
OK, so you’ve got your site set-up and configured in Google Webmaster tools. Now it’s time to start looking at the data.
Your Site on the Web
Google Webmaster Tools allows you to view some basic stats and data for your site. It’s not nearly as robust as Google Analytics–not even close–but it does provide some quick and easy data that you can use to assess your site and correct problem areas.
- Top search queries
- Links to your site
- Keywords
- Internal links
- Subscriber stats
This section of Google Webmaster Tools gives you information on what keywords people are using to find your site. Before discussing this in more detail I want to caution anyone from using this information incorrectly.
Just because a keyword query isn’t listed here doesn’t mean it is not a good keyword to go after. This only represents how people are currently finding you. Keywords not listed here simply mean that you’re not well optimized for those keywords and should not be interpreted as meaning they are not good keywords to optimize for.
Onto the data…
At the top you can filter the results by image, mobile, smartphone and web search results. The default setting is “all” which shows a combination of all of them. If you want to narrow it down to just web search results, select “web” and so on.

You can also filter results by country. Again, the default setting here is all countries. You might want to filter your results for your target country, or see how your your site performs from a number of other countries. If you are an American business or primarily target an American audience, you’ll want to select “United States” to ensure you’re results are filtered properly.
Finally, you can filter the results by date range. The default setting shows data from the last month but you can now change that by any date range you wish. Previously you only had a few options such as “last month,” or “last week.”
At the top you can see a graph of your site impressions and clickthroughs for the selected period of time along with the totals.
Just below that are four columns of data. From left to right you see “Query” which is the keywords used to find your site, “Impressions” which is the number of times your site appeared in a search, “Clickthrough” which is the number of times someone clicked the search result and landed on your site, and “% Clickthrough” which is your clickthrough rate for each term.
Now let’s look at the data displayed, what it means and how you can apply it to your SEO campaign.
Each of the queries is expandable to allow you to get even more detailed stats. As you can see from the image above Google will give you the position your site achieved during the selected time frame. You’ll get individual stats for the first five positions, then stats for positions 6-10 and then 2nd page, 3rd page+.
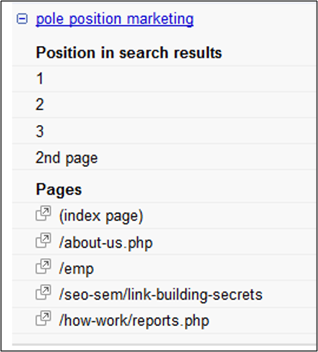
Below the ranking information you’ll see the individual pages that were ranked for the specific keyword selected. The down side here is you can’t see which pages held the any of the positions noted above.
Now, looking at the entire chart for the same keyword as above, you can see the breakdown in the additional columns.
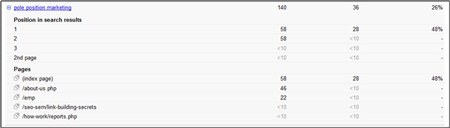
Seeing how many impressions your site received from each “position” is nice, but this information lacks better context. Sometimes you’ll see second and third page rankings getting far more impressions than a first page ranking. This seems to defy logic until you realize that your lower rankings were likely held for a much longer period of time than the higher ranking. It would be nice to see how many days any page held a particular ranking. This would give the impressions much needed context.
The next column of clickthroughs lets you know how many times your site was clicked in each position. You can also see how many times each page was clicked as well. Sometimes these numbers match up nicely so you CAN see which page held which ranking. This chart shows a perfect example. Both the #1 ranking and the home page got 50 impressions and 28 clicks.
Finally, you can see what your click through rate is for each position and page. This simply divides the clickthroughs by the impressions (times 100) to give you a percentage.
The data on this page has changed significantly from just a few weeks ago. Previously you’d see an average position for any keywords and Google didn’t provide any specific page data whatsoever. You also only saw a impression percentage, that represented each query’s percentage of impressions in relation to all the other queries your site appeared for. This is a nice change, moving in the right direction.
With the new data provided by Google you can see which pages are ranking for any given term. Are these the pages you want to rank? Should different pages be ranking that are not? Take this data and adjust your SEO efforts accordingly.
Also, if you find you’re getting a low clickthrough rate, despite good rankings, you may need to adjust your title and descriptions. Tweaking titles and descriptions will help you get more clicks. As your clickthrough rate increases so does your visitor count!
Learn more about these sections of Google Webmaster Tools
- Part I: Setting Up a Site
- Part II: Site configuration
- Part III: Your site on the web
- Part IV: Your site on the web (continued)
- Part V: Diagnostics
- Part VI: Labs
Pingback: SEO With Google Webmaster Tools – Part 1: Setting Up a Site » (EMP) E-Marketing Performance
Pingback: SEO With Google Webmaster Tools – Part 2: Site Configuration » (EMP) E-Marketing Performance
Pingback: SEO With Google Webmaster Tools – Part 4: Your Site on the Web (Continued) » (EMP) E-Marketing Performance
Pingback: SEO With Google Webmaster Tools – Part 5: Diagnostics » (EMP) E-Marketing Performance
Pingback: SEO With Google Webmaster Tools – Part 6: Labs » (EMP) E-Marketing Performance