

You’ve put a lot of time and effort into optimizing a page — from researching keywords to optimizing the on-page elements of your title tag, meta description, alt tags and body content. But are you seeing your work pay off in increased search performance? If you have Google Analytics set up, there’s data to answer that question. I’m going to help you find and evaluate these metrics, then determine if there are other tweaks you can make to perform even better in search.
Search Performance Indicator Metrics
The following metrics are good indicators for how your landing page is performing in search:
- Impressions = the number of times the page showed up in search results viewed by a user, excluding paid search
- Clicks = the number of times the page was clicked on by a user, excluding paid search
- Average position = average ranking position of your website for the queries a given URL appears in search results for
- Click through rate (CTR) = clicks/impressions
A URL that’s above the fold on the first page of search results (for any given query), will most likely have a better CTR than pages that searchers have to scroll or click to a consecutive page of results to see. If your page is not above the fold on the first page, there’s room for improvement. I’ll suggest a few ideas in a minute. First, let’s take a look at the metrics.
In order to get an idea of how the page performed before and after optimization, it’s a good idea to keep track of the metrics in a spreadsheet. This gives you a basis for comparison. If you haven’t recorded metrics for pages prior to optimization, it’s a good idea to start doing so. Before you start the optimization process, record the impressions, clicks, average position and CTR.
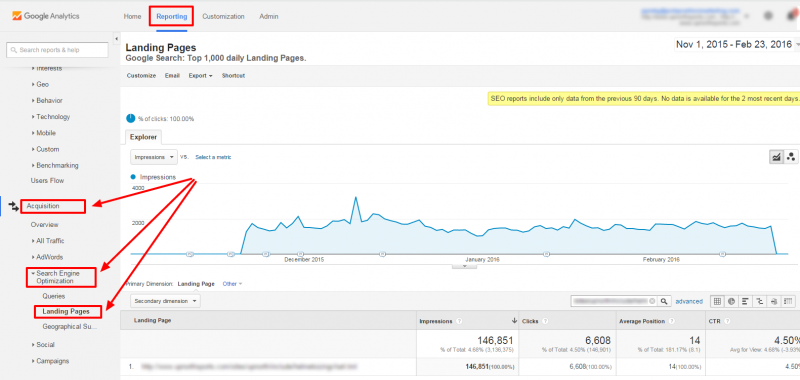
You’ll need to access your Google Analytics account and have a tracking code installed on the landing page to be able to view this data. If you don’t have it, you may need to work with your developer to get it set up. Here’s where you’ll find this report in your Google Analytics dashboard:
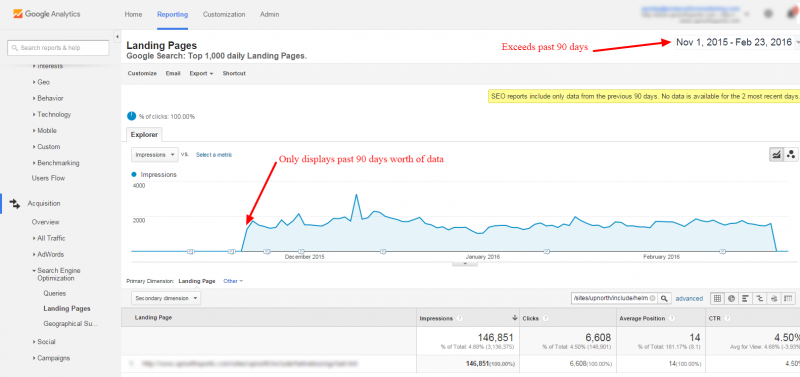
Notice, Google only shows SEO report data for the previous 90 days. So if you enter a custom date range that is outside of that time frame, you’ll see a notification and the data will only represent the past 90 days. That’s another reason why you should record the data in advance of optimization.
A page should perform better once it’s optimized, otherwise what’s the point. Although an optimized page could be performing better than it was when it wasn’t optimized, is it performing to its fullest potential? After the optimized page has been live long enough to collect data, you’ll be able to use the data to decide if there are additional opportunities to pursue.
What the Metrics Might Suggest
Typically, if your site is toward the top of the first page of search results, you’ll see a higher number of impressions and clicks. Here are a few scenarios where that isn’t the case.
Scenario 1: The average position of an optimized page goes from 7 to 4 upon implementation, but the number of clicks stay relatively the same. This could mean searchers are presented with your page, but aren’t enticed to click through to your site. You may need to revisit the page title or meta description to better attract the searcher’s click. A great way to compare your page to the other pages you’re competing with is to do a search and look at the results. If you think your opinion may be biased, ask a friend or family member which result they would click on and why.
Scenario 2: The number of clicks are higher, but the average position is approximately the same after optimization. This could indicate that search volume has increased for a given query and in turn the number of impressions and clicks are higher. In this situation, you may want to revisit the optimization and look for opportunities to further improve the on-page elements. Think about your messaging. Does it match the intent of the searcher that is clicking through to your site? Or are searchers clicking onto the site and leaving because they don’t see what they are looking for? Other considerations could be the usability of your site and/or whether or not it’s mobile friendly.
The scenarios above are just two examples. The possibilities are endless for how and why your metrics may change. I hope you’ll step back from your website and interpret the metrics from the perspective of the search engines and more importantly, the searchers.
Additional Considerations
You might be starting to feel overwhelmed by all the unknowns. You’re not alone. It can be difficult, if not impossible, to pinpoint the exact reason(s) your search indicator metrics change. My best advice is to monitor the metrics closely while considering the following:
- Don’t make any snap judgements – Metrics will change daily, so it’s important to look at the big picture and overall trends before making any changes. Never make decisions based on panic. Give something time and thought before changing it. Look at things from different angles to determine if there are other issues that are more likely to be causing the problem.
- Be aware of widespread changes in the search results or algorithm updates – Search engines, especially Google, are constantly altering how they present search results and making updates to the algorithm that determines what pages show in their results for any given query. The latest SERP (search engine result page) layout change dealt with the number of paid results shown and the location of those results for certain queries. This in turn affected organic results.
- Seasonality trends – Let’s say, for example, you have a landscaping business in Minnesota. Chances are you’ll see a serious decline in impressions, number of clicks and CTR during the winter months, unless you also offer snow removal-type services. Even so, certain keywords will still see a decline in search volume which will directly affect the search indicator metrics.
- Make one change at a time – Optimized pages should be treated similar to a scientific experiment. Here’s a little Science 101 refresher to explain my point: Remember the changing quantities of an experiment are called variables? There are three types: independent, dependent and controlled. In order to conduct a fair test, a sound experiment has only one independent variable (the variable that is changed by the scientist). The same applies to our optimized page. Even though we may have a list of changes that we see as opportunities to improve the page, we only apply one change at a time. If we make all the changes at once, we won’t be able to determine which change caused what outcome.
Taking it to The Next Level
So what if you’ve made adjustments to an optimized page, monitored those adjustments and still aren’t seeing the results?
Remember I asked a few questions at the end of Scenario 2 above trying to get you to think about the searcher? If you have your Google Analytics and Google Search Console accounts connected, you can see the queries (for the past 90 days) that your page is appearing in Google search results for. This gives you increased intel about why searchers are coming to your site and thus allows you to compare the content and messaging of the page with the queries.
For example, I have an eCommerce client who sells snowmobile gear. I recently reviewed one of the optimized pages that we rolled out for them a few weeks ago. The page is about how to size a helmet and includes a sizing chart. When I reviewed the queries that Google shows the page for, there were “motorcycle” phrases in the list.
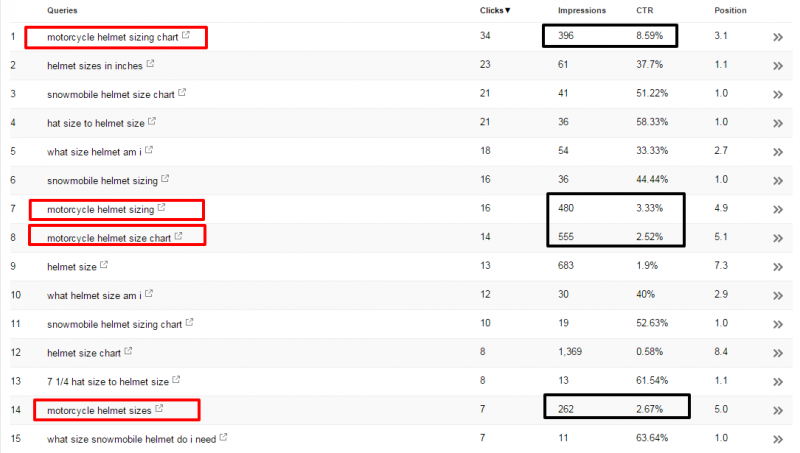
I also noticed that the number of impressions is higher for the “motorcycle” terms than for the “snowmobile” terms. This could be because the sheer search volume is higher. But I also thought it was worth asking my client if the information on their page is applicable to motorcycle helmets as well as snowmobile helmets. Their response will help me to reevaluate the page and determine if we should go back and reassess the optimization to include motorcycle helmets.
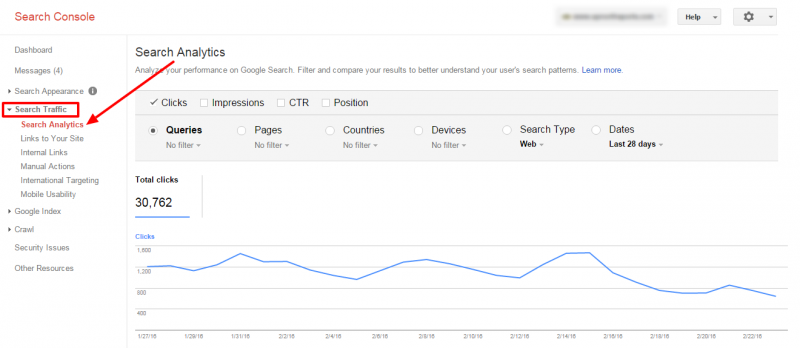
To see what queries are triggering Google to show your optimized landing page, you’ll need to navigate to Search Analytics in Google Search Console:
After you navigate there, you’ll want to filter by the landing page and date range you want to see queries for:
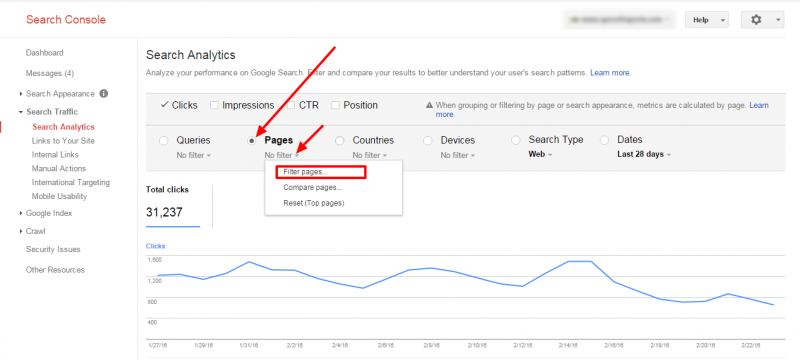
Click on “Pages,” then click the “No filter” drop down arrow and select “Filter pages.”
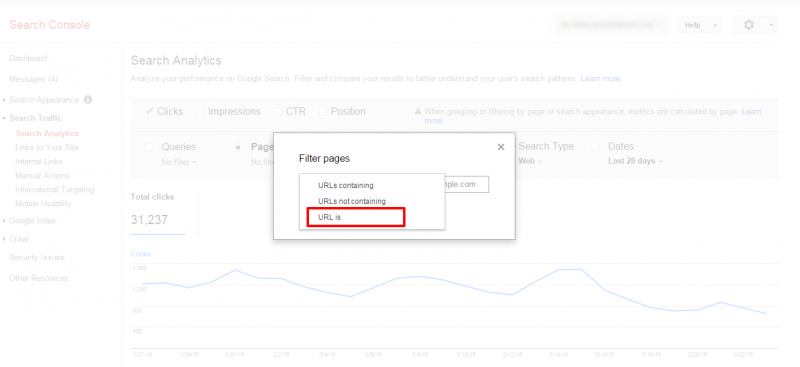
A box will pop up. Click on the drop down arrow next to “URLs containing” and choose “URL is.”
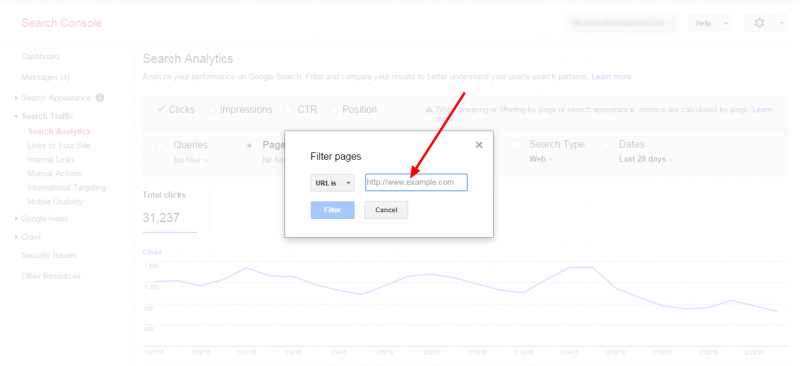
Enter the exact URL of the landing page you want to see queries for.
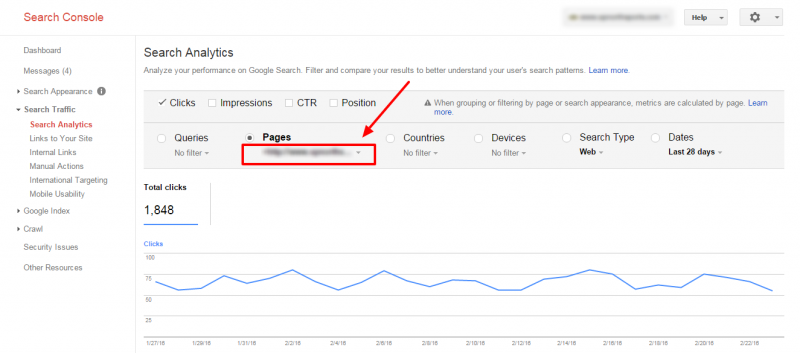
Once you set the URL, you should see the URL appear underneath the “Pages” selection.
Now, you’ll need to set the date range.
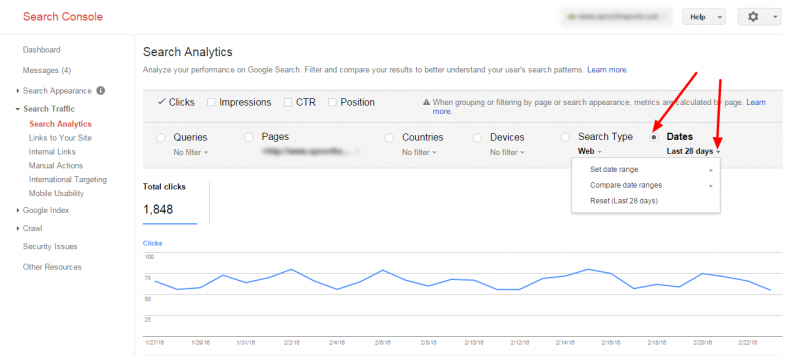
Click “Dates,” and then click the drop down arrow beside “Last 28 days.”
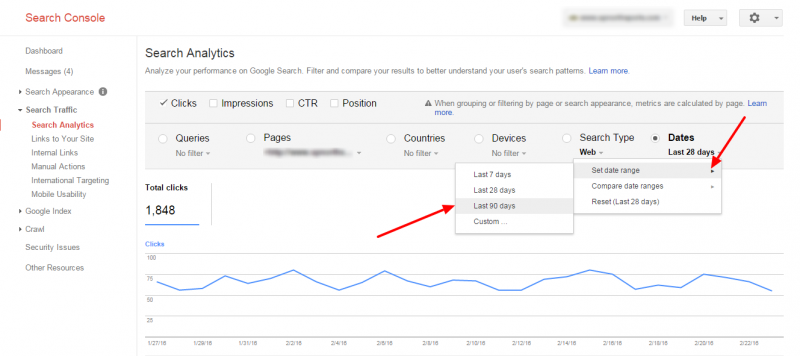
Click “Set date range,” then select “Last 90 days” to get the most amount of query data that Google allows.
Now that you have your page and date range set, click back on “Queries,” and you’ll have a list of queries for that URL and date range. This will allow you to do some further assessment on what opportunities you may have missed in your optimization. If the queries make sense for the page and you’ve not considered them, now is the time. If the page isn’t a good fit for the queries but your business is, create a new page or optimize another page that is relevant for the queries.
Final Thoughts
There can be many reasons that your optimized page isn’t performing the way you’d like it to. The best thing you can do is look at the metrics and try to come up with steps for improving it. Look at your optimization from the perspective of a searcher and ask yourself what’s missing. Get other people to give you input. After making a change, reassess and give it time to reflect in the metrics.
Remember, this is a process, and there are a lot of moving parts that you don’t have control of. Do what you can, what makes sense and ultimately what will benefit the user, and you’ll most likely see it reflected in increased search performance.