Google, Yahoo and Bing have made setting up pay-per-click (PPC) campaigns fairly easy and painless. Within hours you can have your ads up and running, and delivering traffic to your website for a small fee per click. Unfortunately, the ease in which a campaign can be set up often convinces business owners that they can throw up some PPC ads and the money will start pouring in. I’ve talked to many businesses that think PPC doesn’t work because they tried it once and never made any money.
It’s not that PPC doesn’t work, it’s that the campaigns were not set up and managed properly. All too often a PPC campaign is created by the business owner but left to run with little or no management, supervision or oversight. Even a properly (or professionally) set up campaign needs constant oversight.
Proper set-up and management of your PPC campaigns is vitally important to ensure you have a profitable and high ROI PPC campaign. Without effective bid management and ongoing testing of ads and landing pages the campaign will soon be nothing more than an expensive traffic delivery method. As time passes, bid clicks will rise, positioning of ads will fall, landing pages won’t be as targeted and your cost per conversion will increase. Your PPC campaign may continue to deliver both traffic and sales, but the cost of those sales may be outside of your zone of profitability.
Most PPC campaign managers don’t truly know how much the business can afford to pay on a per-click basis. Worse, they don’t manage their overall cost per conversion being delivered. Instead, they look at the cost as a whole, and try to make sure every $100 spent in advertising brings back at least $100 plus the cost of the product or service sold. This is a break even strategy at best–and often times a losing strategy.
Finding the cost per conversion ceiling
For most businesses, the “cost” of a PPC campaign cannot be taken as a whole. Within each product and service category offered, there is a varying degree of profit that must be factored into the overall cost of the campaign. Each of these profit levels must be broken down and/or grouped together in order to ensure that the profitability and success of the campaign can be properly tracked.
When you don’t consider each product or service separately, you’ll likely end up using the profits in one area to pay for a loss in another. When every area is considered separately, you can ensure that each and every area is profitable in its own right.
To manage a PPC campaign successfully you must know your cost per conversion ceiling for each product or service group you offer. With proper tracking you can make sure that every click, regardless of how much it costs, is making–and not costing you–money.
To help you understand this we’ll work our way through a PPC campaign for a fictional company called Sexy Doodads, Inc. I’ll use round numbers in order to make this as painless as possible.
Sexy Doodads, Inc.
Sexy Doodads, Inc. manufactures and sells doodads that they manufacture themselves and also from other manufacturers. The profit margin on doodads they manufacture is greater than those they sell from other manufacturers. Their doodads come in a variety of flavors: red, blue, green, luxury, etc. The color of the doodads doesn’t effect the price much, but luxury doodads are a bit more expensive.
SexyDoodads, Inc. also provides a doodad installation/repair/warranty service. While leads come in online through the PPC account the repair service can only be sold over the phone due to customization requirements. The tools you use to manage your PPC accounts will only give you the cost of conversion to the lead, however not every lead converts to a sale. Therefore we’ll need to incorporate some offline figures in order to figure out the true cost per conversion on these. More on that later.
I’ll walk you through all of the calculations here, but first we want to separate our doodads into groups based on similarity in terms of costs and profits. For our purposes we’ll break them into these five groups, each requiring it’s own set of calculations:

Here we have two brands: X and Y. We can say that brand X is manufacturers by Sexy Doodads, Inc. and Brand Y is all other manufacturers. We could also create a Brand A, B, C, etc. one for each manufacturer if profits and price vary dramatically enough, but there is no need to do that for this example.
We also have a luxury line, both for Brands X and Y. The Luxury sell for a bit more and have better profits which is why they need their own group. Finally, we have a grouping for the Doodad repair service which isn’t a product at all. While covering all five different product groups here can make this post a bit complex to follow, I wanted to make sure you can see how small differences in sales and profit margins can make a big difference in profitability.
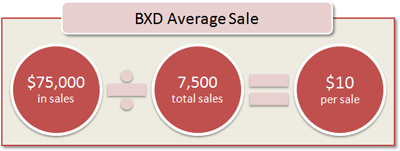
How much is your average sale?
If you pay close attention to your business accounting you may already know the answer to the question posed above. Unfortunately, most businesses don’t. While it may not be an important metric when looking at the profitability of your business, it is an important metric in ensuring your PPC campaigns remain profitable. This is our starting point for effective PPC campaign management.
Last year Sexy Doodads, Inc. sold:

They have also kept track of how many individual products sold within each group:

Since there are a number of options within each group the pricing also varies a small amount. You first want to figure out the average sale amount for any product or service group. For each product group simply take the total amount of income received and divide by the total number of sales. For Sexy Doodads, Inc. the average sale amount of each item per item group is as follows:


Remember, we are using round numbers here so these calculations look like something you could simply guess at. But keep in mind most companies sell similar products at different price points. There might be a difference from a few cents to several dollars. We simply created groups based on similar sales price and profit margins.
How much is your profit?
Now that we have an average sale per product, we have to factor in the actual profit margin of each product group in order to make sure our PPC campaigns are profitable. It does you no good to pay $8 to sell a product that costs $5 to manufacture . Figuring out the profit will give us the maximum cost per conversion we need in order to ensure you are making money, not losing it.
To ensure a company makes a profit they usually add a markup cost on the products they sell. Since services don’t have a “markup” in the same way products we’ll consider the markup added to the known cost of installation and repair time.
Here is the markup Sexy Doodads, Inc. adds to the cost of the products they sell:

Markup, however, is not synonymous with profit margin. It is merely the percentage that the price is increased from the cost to purchase or manufacture it yourselves in order to cover additional costs such as shipping, handling, miscellaneous expenses, and (hopefully) a profit.
Since the markup isn’t usually 100% profit on top of all other expenses, I generally adjust it down by 5-15 percentage points to try to create a best guesstimate of the profit margin for each product.
Accordingly, Sexy Doodad, Inc.’s estimated profit margins are as follows:

To figure out the profit of each product group, you need to multiply the average sale amount found earlier by estimated profit margin:


Additional Steps for Leads
PPC tracking mechanisms stop once the online “conversion” is made. This might be a sale that is completed, a form that is submitted, or even an information sheet that is downloaded. When dealing with leads, because the sale is handled offline you have to factor in some additional components to ensure you truly find your maximum cost per conversion ceiling.
The profit per sale noted above is accurate for leads only if you converted 100% of your leads. Generally that’s not the case. You have to factor in your actual conversion rate of the leads that you get.
Let’s say you close 50% of the leads that come from the PPC campaign. You have to multiply that percentage by the “profit” you get from the leads:

Maximum Cost Per Conversion
The profit figures above tell you the absolute maximum cost per conversion ceiling for each product group. This is your break even point. If you keep your cost per conversion (not cost per click!) under these amounts then you will never lose money on PPC. If your cost per conversion is higher then those figures then you are losing money. Ideally you want to find the sweet spot where you are as far under that ceiling as possible without cutting into your ability to drive traffic and sales.
One other point to make about these figures: Now that you can clearly see which product groups give you the best profits, you want to focus the majority of your PPC efforts (and spending) on those product groups. Much money is wasted in PPC by spending money on the groups that get the most clicks instead of those that get the most profit. Sometimes they are one in the same, but not always. By directing your funds to the higher profit campaigns you can make sure you get more profit for every dollar spent!
The information here is a good starting point for most businesses. The calculations provided are pretty easy to work out and will give you a strong base of reference for optimizing your PPC campaign.
But many industries in competitive fields may find it difficult to tweak their campaigns enough to get their cost per conversion under the profit figures calculated here. As much as I want to say that these figures represent your maximum cost per conversion, they don’t. There is additional data that can be factored in such as product re-purchase rates, customer faithfulness and retention, and more. Factoring in these additional components will give you a little more leeway in getting your PPC campaigns profitable while bringing in as much converting traffic as possible without going over budget.
I’ll address these additional components in the advanced version of this post which picks up where this one leaves off. The goal is to find that absolute sweet spot of profitability to ensure you get the most out of your PPC campaign.